# OCI Satellite Metrics Overview
The CMDB-360 OCI Satellite provides visibility into the cloud resources provisioned within an Oracle Cloud Infrastructure tenancy or designated compartments. In addition to the discovery of core resources such as Compute Service, Databases (OCI DB Systems, Autonomous Database), and Networking (Virtual Cloud Network, Load Balancers), the OCI Satellite also provides access to real-time and historical metrics from many of these discovered cloud resources.
# OCI Policy Requirements
By default, the OCI Satellite is designed to be granted read-only access to the OCI tenancy so it may properly discover all core cloud resources in the tenancy. The OCI Satellite cascades through the various compartments of the tenancy and discovers cloud resources, then reports only the key details (no sensitive details) to the CMDB-360 Base Station – this process is called “asset discovery”.
You may also choose to only allow the OCI Satellite to have access to certain compartments with the OCI tenancy. This may be done by configuring policies used by Instance Principals or the named user. These principals also apply to the access of real-time and historical metrics.
By default, the read-only policy granted to the OCI Satellite is:
ALLOW group cmdb360-group to read all-resources in tenancy
This will grant access to metrics. The specific policy granted to allow access to metrics is as follows:
ALLOW group cmdb360-group to inspect metrics in tenancy

ALLOW group cmdb360-group to read metrics in tenancy
# Available Metrics
The available OCI Satellite Metrics for each resource type are as follows:
# Compute Service (Instance Metrics)
| Metric ID | Metric Display Name | Unit | Description | Threshold |
|---|---|---|---|---|
| CpuUtilization | CPU Utilization | percent | Activity level from CPU. Expressed as a percentage of total time. For instance pools, the value is averaged across all instances in the pool. | WARNING: > 80% for 10 min CRITICAL: > 95% for 10 min |
| DiskBytesRead | Disk Read Bytes | bytes | Read throughput. Expressed as bytes read per interval. | Informational for troubleshooting. No metric needed |
| DiskBytesWritten | Disk Write Bytes | bytes | Write throughput. Expressed as bytes written per interval. | Informational for troubleshooting. No metric needed |
| DiskIopsRead | Disk Read I/O | operations | Activity level from I/O reads. Expressed as reads per interval. | Informational for troubleshooting. No metric needed |
| DiskIopsWritten | Disk Write I/O | operations | Activity level from I/O writes. Expressed as writes per interval. | Informational for troubleshooting. No metric needed |
| LoadAverage | Load Average | number of processes | Average system load calculated over a 1-minute period. | |
| MemoryAllocationStalls | Memory Allocation Stalls | number of stalls | Number of times page reclaim was called directly. | |
| MemoryUtilization | Memory Utilization | percent | Space currently in use. Measured by pages. Expressed as a percentage of used pages. For instance pools, the value is averaged across all instances in the pool. | |
| NetworksBytesIn | Network Receive Bytes | bytes | Network receipt throughput. Expressed as bytes received. | |
| NetworksBytesOut | Network Transmit Bytes | bytes | Network transmission throughput. Expressed as bytes transmitted. |
Disk (Boot & Block Volume Metrics)
| Metric | Metric Display Name | Unit | Description | Threshold |
|---|---|---|---|---|
| VolumeReadThroughput | Volume Read Throughput | bytes | Read throughput. Expressed as bytes read per interval. | |
| VolumeWriteThroughput | Volume Write Throughput | bytes | Write throughput. Expressed as bytes written per interval. | |
| VolumeReadOps | Volume Read Operations | reads | Activity level from I/O reads. Expressed as reads per interval. | |
| VolumeWriteOps | Volume Write Operations | writes | Activity level from I/O writes. Expressed as writes per interval. |
VNIC & Network Metrics
| Metric | Metric Display Name | Unit | Description | Threshold |
|---|---|---|---|---|
| VnicEgressDropsSecurityList | Egress Packets Dropped by Security List | packets | Packets sent by the VNIC, destined for the network, dropped due to security rule violations. | |
| VnicIngressDropsSecurityList | Ingress Packets Dropped by Security List | packets | Packets received from the network, destined for the VNIC, dropped due to security rule violations. | |
| VnicFromNetworkBytes | Bytes from Network | bytes | Bytes received at the VNIC from the network, after drops. | |
| VnicFromNetworkPackets | Packets from Network | packets | Packets received at the VNIC from the network, after drops. | |
| VnicToNetworkBytes | Bytes to Network | bytes | Bytes sent from the VNIC to the network, before drops. | |
| VnicToNetworkPackets | Packets to Network | packets | Packets sent from the VNIC to the network, before drops. | |
| VnicIngressDropsThrottle | Throttled Egress Packets | packets | Packets received from the network, destined for the VNIC, dropped due to throttling. | |
| VnicEgressDropsThrottle | Throttled Egress Packets | packets | Packets sent from the VNIC, destined for the network, dropped due to throttling. | |
| VnicIngressDropsConntrackFull | Ingress Packets Dropped by Full Connection Tracking Table | packets | Packets received from the network, destined for the VNIC, dropped due to full connection tracking table. | |
| VnicEgressDropsConntrackFull | Egress Packets Dropped by Full Connection Tracking Table | packets | Packets sent from the VNIC, destined for the network, dropped due to full connection tracking table. | |
| VnicConntrackUtilPercent | Connection Tracking Table Utilization | percentage | Total utilization percentage (0-100%) of the connection tracking table. | |
| VnicConntrackIsFull | Connection Tracking Table Full | boolean | Boolean (0/false, 1/true) that indicates the connection tracking table is full |
# Access To Metrics
Metrics are captured from the OCI Metrics Service on both an “on-demand” basis (where a call is made to the OCI API) for any available metrics for the past 90 days or on a “summary” basis for any metrics up to one year.
# CMDB-360 Portal
All supported OCI cloud resources in CMDB-360 provide a metrics tree view which displays the current available metrics as provided by the OCI Metrics Service. This tree if dynamic based on the resource type. The Compute Service (Instance Metrics) are shown below:
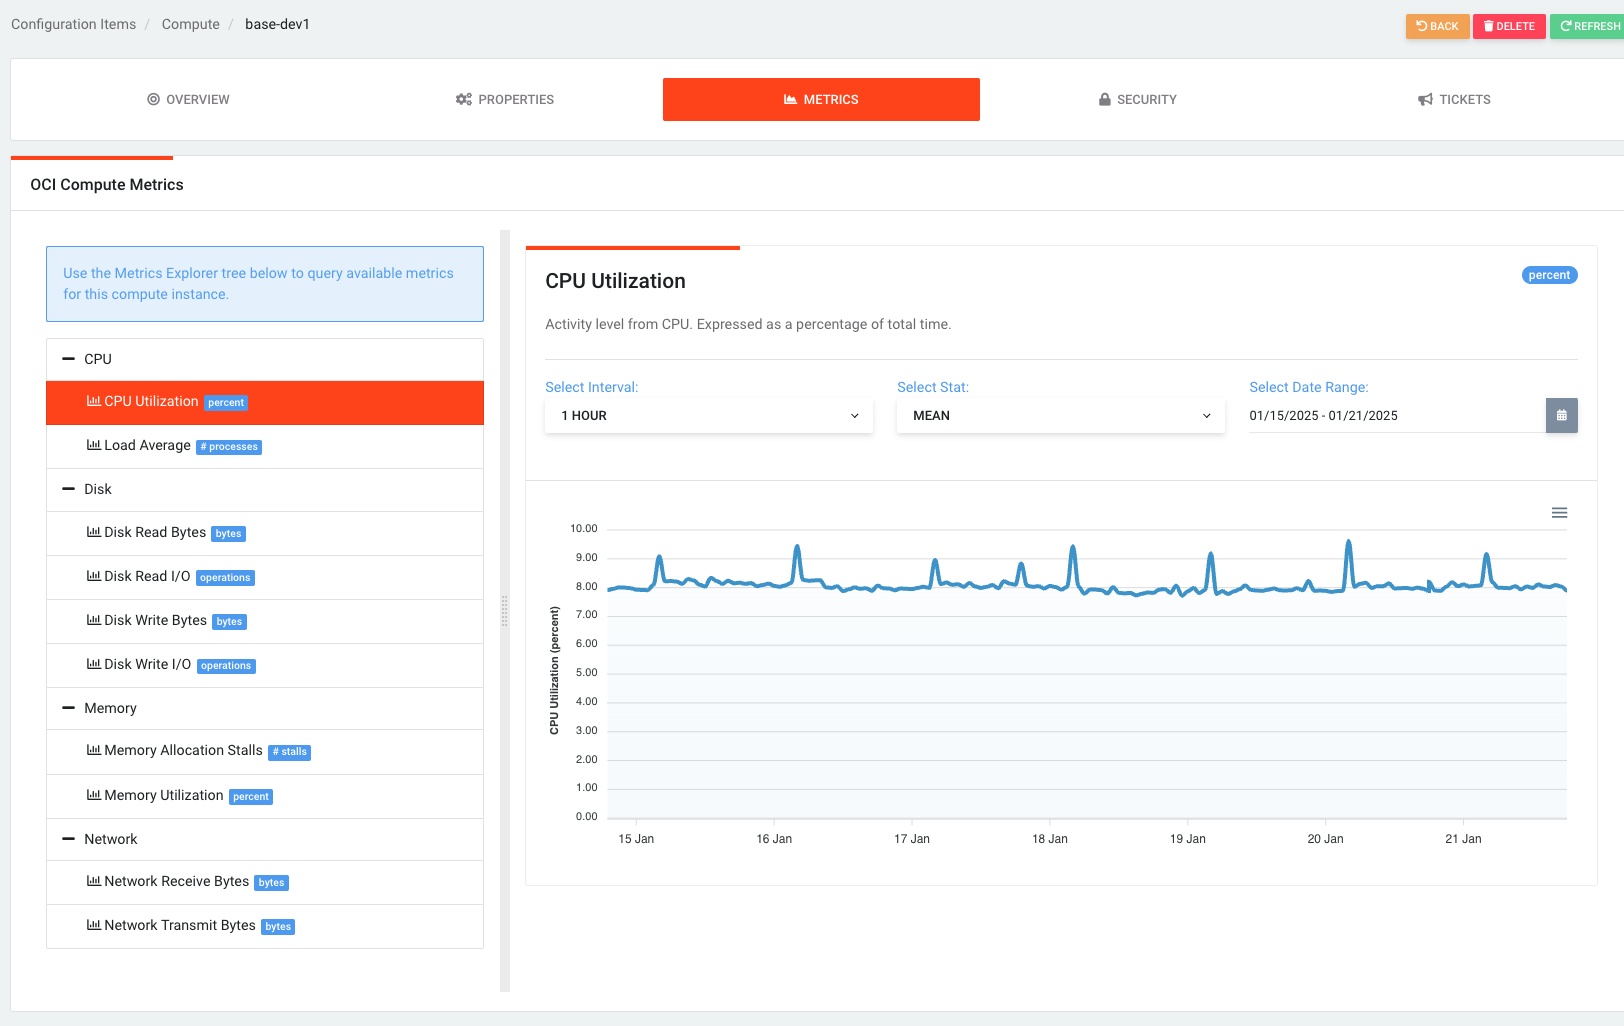
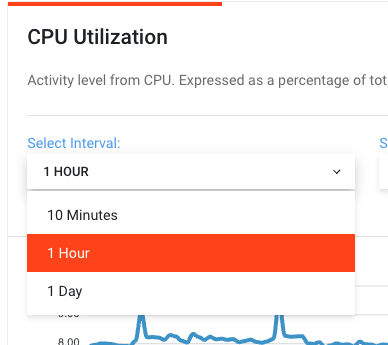
The CMDB-360 Metrics display screen allows you to toggle the interval of the metrics to view, the statistic to consider, and also the date ranges to display:
# CMDB-360 REST API
The CMDB-360 REST API allows access to the available metrics of any supported resource using the /metrics endpoint. You must POST filters to support the metric type, including the interval, statistic and date ranges. See the CMDB-360 REST API documentation for more details.